
SUMMARY
When setting up animation keys in a Nuke script (for example keying the position of a Transform node or Roto mask), defining animation curves via Python can give a lot of flexibility. Users can automate the generation and positioning of animation keys, adjust slopes to their needs and share the curves data across different tools used within the pipeline.
This article explains how to create animation keys and update curve slopes through the use of Python, including a testable example script.
MORE INFORMATION
When animation keys are set up within Nuke (by Animating Parameters), the keyframes are displayed as curves within the Curve Editor.
In the screenshot below, you can see the curve created from animation keys set at various frames, for the contrast knob of a ColorCorrect node:
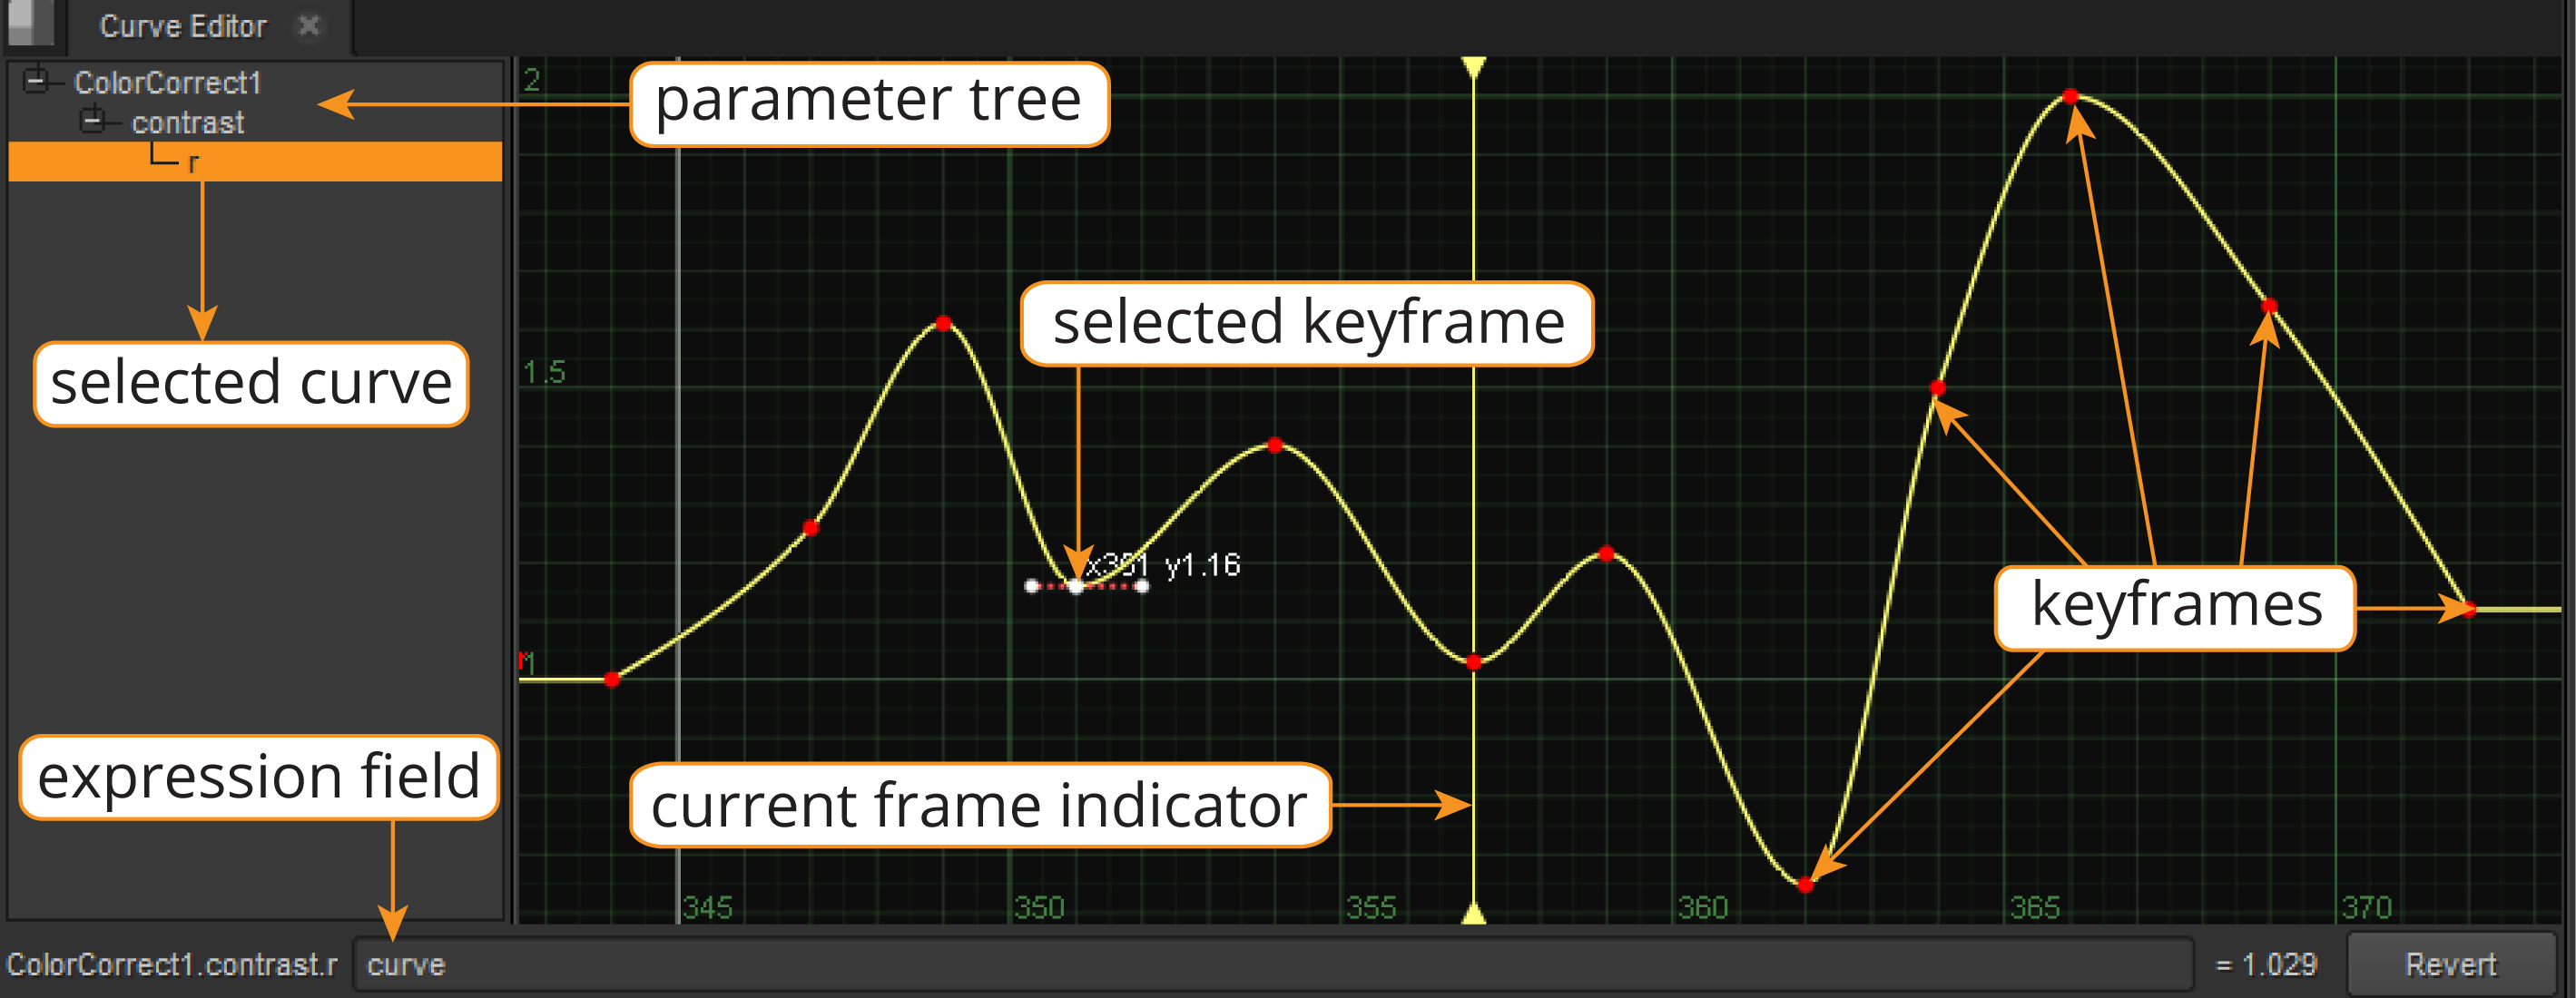
- The key values are where the user has added a new value to the contrast knob.
- The Curve Editor uses an XY graph, where X shows the frame range and Y shows the contrast knob values.
- The user's selected keyframe is frame 351, with a value of 1.16.
- The selected keyframe also display its tangents that define the slope. Manipulating the slope will customise the curves shape between keyframes to make it more smooth or constant.
- The selected curve is using a smooth interpolation
- The expression field displays that its expression is curve, this means the animation is being controlled by the curve within the Curve editor.
SETTING UP KEYFRAMES USING PYTHON
There are multiple attributes that need to be set up for each key, when creating keyframe animations, via a Python script.
These include the following:
- x - The horizontal position of the point (the frame value)
- y - The vertical position of the point (the knob value)
- interpolation - Used to calculate all slopes except the left slope of the first key & right slope of the last key
- extrapolation - Calculates the left-most and right-most slopes
To set up a custom interpolation, you can individually edit the tangents of each key created by setting the following attributes:
- lslope - The derivative to the left of the point
- rslope - The derivative to the right of the point
- la - The left 'bicubic' value
- ra - The right 'bicubic' value
Here is a screenshot displaying a keyframe's tangents, highlighting lslope and rslope:
To learn more about the Python AnimationKey class and which options you can use for the interpolation and extrapolation attributes, please check the AnimationKey section of the Nuke Python API Reference guide.
EXAMPLE SCRIPT
Attached you can find an example Python script which shows how to automate the creation of a keyframe animation curve. When this is executed into Nuke's Script Editor, it will create a Constant node with an animated color knob.
To review the script please download and open the attached file (CurveTest.py) in either the Nuke's Script Editor or a Text editing software (such as PyCharm, Sublime Text, Notepad++, etc).
USING THE SCRIPT IN NUKE
Within Nuke, the script can be tested by importing the CurveTest.py file or copy/pasting its content into the Script Editor, then executing it.
Once the script is executed, it will create a Constant node with animation keys on the color knob.
Selecting the node and viewing it in the Curve Editor will allow you to inspect its animation keys and view the curve that have been generated.
Below is the script's output you can inspect in the Curve Editor tab:
It is possible to manipulate the keys manually. Selecting one key will display its tangents which can be manipulated further.
For more information on editing curves including advanced tips and processes, please read the Editing Curves section of the Nuke documentation.
SCRIPT EXPLANATION
The CurveTest.py Python script includes comments explaining what each function does and why it is used in the script. Below is included a higher level overview of certain functions and concepts:
Setting up the animation curve variables
The script begins with the initialization of the data used for defining the animation curve.
A way to set this data up is to keep the key's frame, value & tangent information within a Python dictionary object, as:
# Curve data stored in dictionary object
curve_data = {1: {'val': 1, 'in_slope': 0.0},
              30: {'val': 10, 'in_slope': 0.0},
              50: {'val': 5, 'in_slope': -56.957},
              60: {'val': 0, 'in_slope': -14.341},
              70: {'val': 5, 'in_slope': 56.957},
              80: {'val': 5, 'in_slope': -77.891},
              90: {'val': 5, 'in_slope': 0.0}}
New animation keyframes are appended to the dictionary object, and the dictionary is then looped through adding each key to the animation curve.
Using function
To make the curve efficient and reusable in other scripts, all the functions are kept in a def (function). This can be easily integrated into other Python scripts as all the definition relies on, is the 'curve_data' given by the dictionary object:
def create_curve(curve_data):
Setting the Node and Knob
In the script's example case, we create a Constant node and store the curve animation data into its color knob. If you want to use this setup for a different node and knob, you can replace their name in the below lines:
node = nuke.createNode('Constant')
attr = node['color']
attr.setAnimated()
The knob must additionally be set to 'animated' so that the multiple keys can be added to the animated knob.
Custom Interpolation
As described within the AnimationKey documentation, if nuke.USER_SET_SLOPE is set, the interpolation and extrapolation are ignored and user-generated tangents will be used instead.
If you look at line 55 in the Python script, the changeInterpolation() function is set to 'nuke.USER_SET_SLOPE' which means the animation curve is using custom interpolation tangents.
curve.changeInterpolation(keys, nuke.USER_SET_SLOPE)If you add a print statement like:
curve.changeInterpolation(keys, nuke.USER_SET_SLOPE)
print (curve.toScript())
Then execute the script in the Script Editor, you will receive the following custom interpolation information from within the curve:
{curve l x1 1 s0 x30 10 s0 x50 5 s-56.957 x60 0 s-14.341 5 s56.957 5 s-77.891 5 s0}All the custom created tangents have been added successfully to the animation curve and should appear in your Constant node's color knob.
If you execute the example script with curve.changeInterpolation(keys, nuke.USER_SET_SLOPE) commented out, and adding the same print statement:
#curve.changeInterpolation(keys, nuke.USER_SET_SLOPE)
print(curve.toScript())
The curve will display the default data as:
{curve x1 1 x30 10 x50 5 x60 0 5 5 5}
NOTE: Manipulating the keys of the newly created animation curve will reset the curve interpolation to the default state, as described in the AnimationKey section of the Nuke Python API Reference guide.
We're sorry to hear that
Please tell us why