
SUMMARY
This article provides guidance on what to do if a Nuke script has become very heavy and slow to navigate.MORE INFORMATION
If a script has become slow or unresponsive then we would recommend you do the following to either try and diagnose the causes of the slowness, or try to improve the current performance:
TROUBLESHOOTING
Test the script in safe mode
Testing the script in safe mode may help you identify whether the issue might be related to a customization/third party plug-in you're using, or Nuke itself. The following article provides instructions for how to launch Nuke in safe mode:
Q100038: Launching Nuke/NukeX/NukeStudio in safe mode
Test with Script Profiling enabled
-P argument when launching from the terminal/command prompt:C:\Program Files\Nuke16.0v4\Nuke16.0.exe -P
/Applications/Nuke16.0v4/Nuke16.0v4.app/Contents/MacOS/Nuke16.0 -P
/usr/local/Nuke16.0v4/Nuke16.0 -P
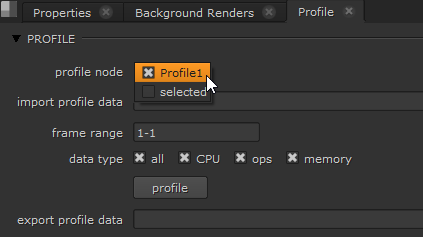
To run the profile, enter the selected frame range and data type then click, profile.
You can find information on how to use Profiling to isolate performance issues in the following article: Q100225: Profiling your Nuke script to isolate performance issues
IMPROVING PERFORMANCE
Disabling thumbnails or setting static frames
Disabling thumbnails, or setting them to static frames, may help reduce the amount of processing happening within the script. You can find more information about this in the following article:
Q100036: How to improve Nuke script performance by disabling thumbnails or setting them to static frames
By using the Precomp node you can save a subset of the node tree as a separate .nk script, render the output of this saved script, and read the rendered output back into the main comp as a single image input.
This speeds up render time, as Nuke only has to process the single image input instead of all the nodes that were used to create it.
For more information, please reference Nuke's online documentation regarding the Precomp node.
We're sorry to hear that
Please tell us why